
debug module
from sqlkit import debug as dbg
purpose
This module provides easy way to debug with print commands. This is not in general my preferred way of debugging (pdb within ipython being my preferred solution). Nevertheless I found myself in need of these functions.
Printing of messages can be easily switched on or off.
Printing can diverted to a gtk widget.
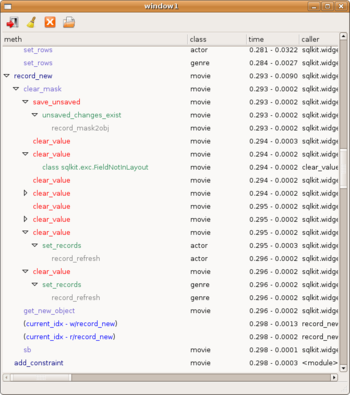
Methods of Classes can be tracked in the way reported in the image, where blue rows correspond to dbg.write commands and all the rest is tracking of methods calls.
use
switching debug on & off
The way to use this is
in you library:
from sqlkit import debug as dbg
dbg.write('text message', 'text2')
in you application:
from sqlkit import debug as dbg
dbg.debug(True)
write() - caller()
from now on, each time you use dbg.write()/dbg.caller() you’ll see the text you want to log anly if you enabled it with dbg.debug(True)
If you want the log to happen in a gtk.TreeView window, you can specify:;
import dbg dbg.debug(True, gtk=True)
Logging methods
Following recipe 198078 in the ASP Python CookBook (see in the code) this module provides also a metaclass to trace the use of methods of a particular class. It will be instantiated as:
class A(object):
    __metaclass__ = dbg.LogTheMethods
for each method call a line will be logged (unless configured to be ignored) with
function called caller class arguments caller function line of code return code calling class time elapsed
IMPORTANT: since the logging occurs with metaclasses you need to import dbg and set debugging before importing the class you want to trace:
from sqlkit import debug as dbg
dbg.debug(True, gtk=True)
dbg.trace_class('SqlTable2')  # optional
dbg.trace_function(exclude='cell_default_cb|cell_bool_cb')  # optional
import sqlkit
TraceIt
in case you need to understand who is changing the value of a variable, you can use TraceIt as:
commit_allowed = dbg.TraceIt(True, name='commit_allowed', mode='rw')
and use it as a normal variable. You’ll get lines in your output stating who changed the value of that variable, in the form:
__str__/function_name:  old_value => new_value
__get__/function_name:  value